
Find out how full your classes actually run with the Fill Rate report

Tobias Gundry
Updated
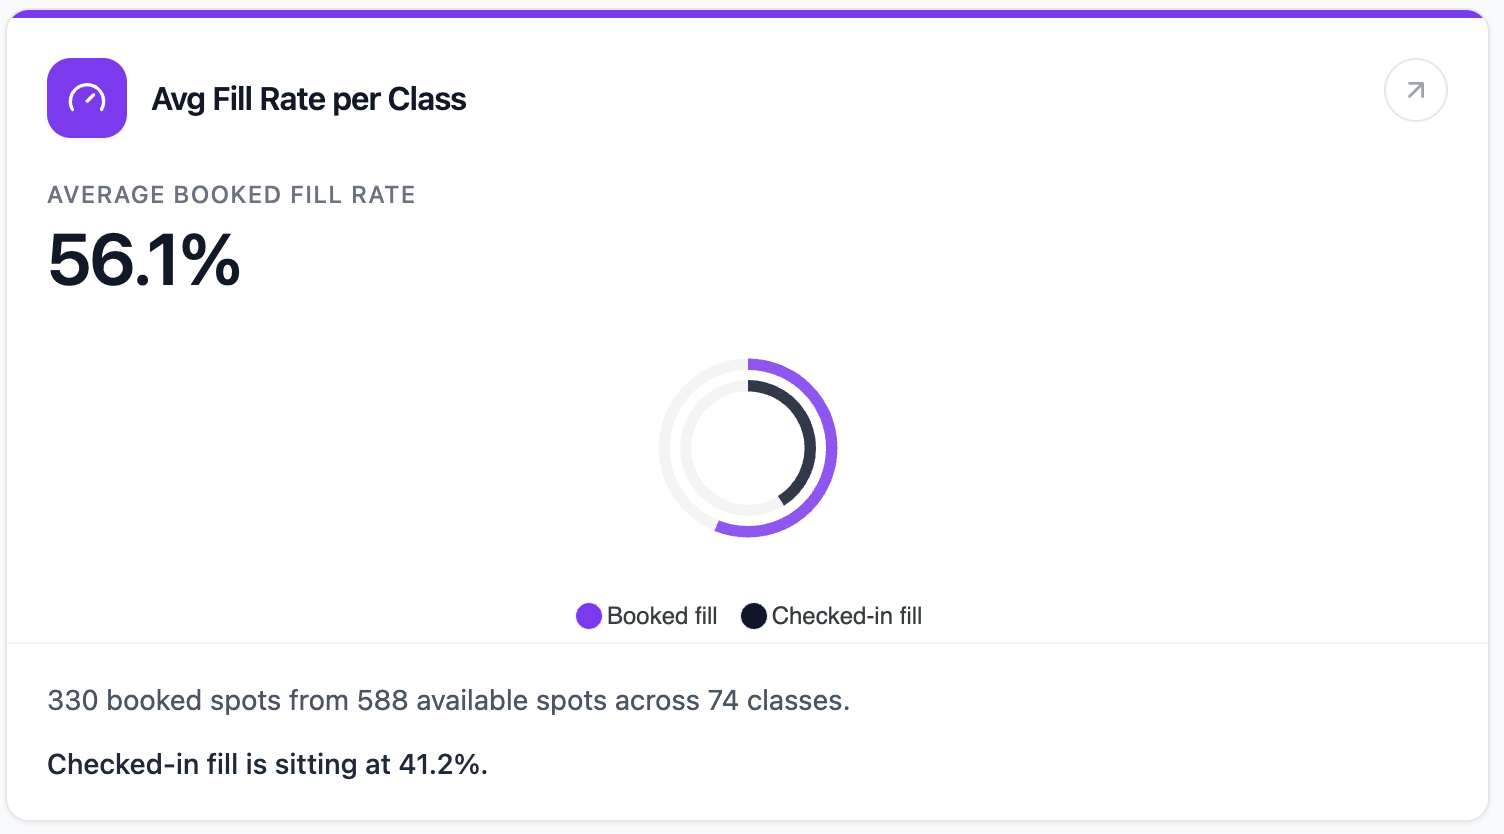
The Avg Fill Rate per Class report shows how efficiently your available class spots are being used.
Where To Find It
Open Reporting, then select Avg Fill Rate per Class.
Why This Report Matters
Fill rate helps you understand schedule performance. It shows whether classes are attracting enough bookings for the capacity available, and whether booked demand is converting into actual attendance.
This report is useful when you are deciding whether to add classes, reduce classes, change class times, move classes to different rooms, or promote underused sessions.
How To Read It
- Average booked fill rate is the percentage of available spots that were booked.
- Checked-in fill shows the percentage of available spots that were actually attended.
- Classes counted shows how many scheduled classes were included.
- Booked spots shows the total number of spots reserved.
- Top filled classes shows which classes used their available spots best.
What The Number Means
A high booked fill rate means demand is strong for the capacity on offer. A lower booked fill rate may mean the class needs promotion, a better time slot, a different room size, or a timetable review.
If booked fill is high but checked-in fill is lower, customers are reserving spots but not always arriving. In that case, compare this report with Cancellations & No-Shows.
How Clovo Calculates It
Clovo looks at scheduled classes that were not cancelled in the past 30 days. It divides booked spots by available spots to calculate booked fill, then divides checked-in spots by available spots to calculate checked-in fill.
Complimentary bookings are included because they still take a spot in the room.
Related articles
Find where booked places are being lost with the Cancellations & No-Shows report
Read the Cancellations & No-Shows report: what its 30-day window really covers, why the 24-hour late-cancel split is not your penalty policy, and what the Leakiest classes list leaves out.
Spot members leaving before it shows in your revenue with the Churn Rate report
The Churn Rate report measures the recurring memberships cancelled in the past 30 days against the member base you started that window with, counted from the day each member asked to leave.
Answer questions about your studio with Clovo reports
Reports help you understand what is happening across your studio without needing to build your own spreadsheets. Each report is designed to answer one clear business question, then show the numbers that explain the answer.
Check whether clients are building a habit with the Visits per Customer report
The Avg Visits per Customer report shows how often active customers are booking and attending classes across the past 30 days.