
See what each client spends with you every month with the Spend per Customer report

Tobias Gundry
Updated
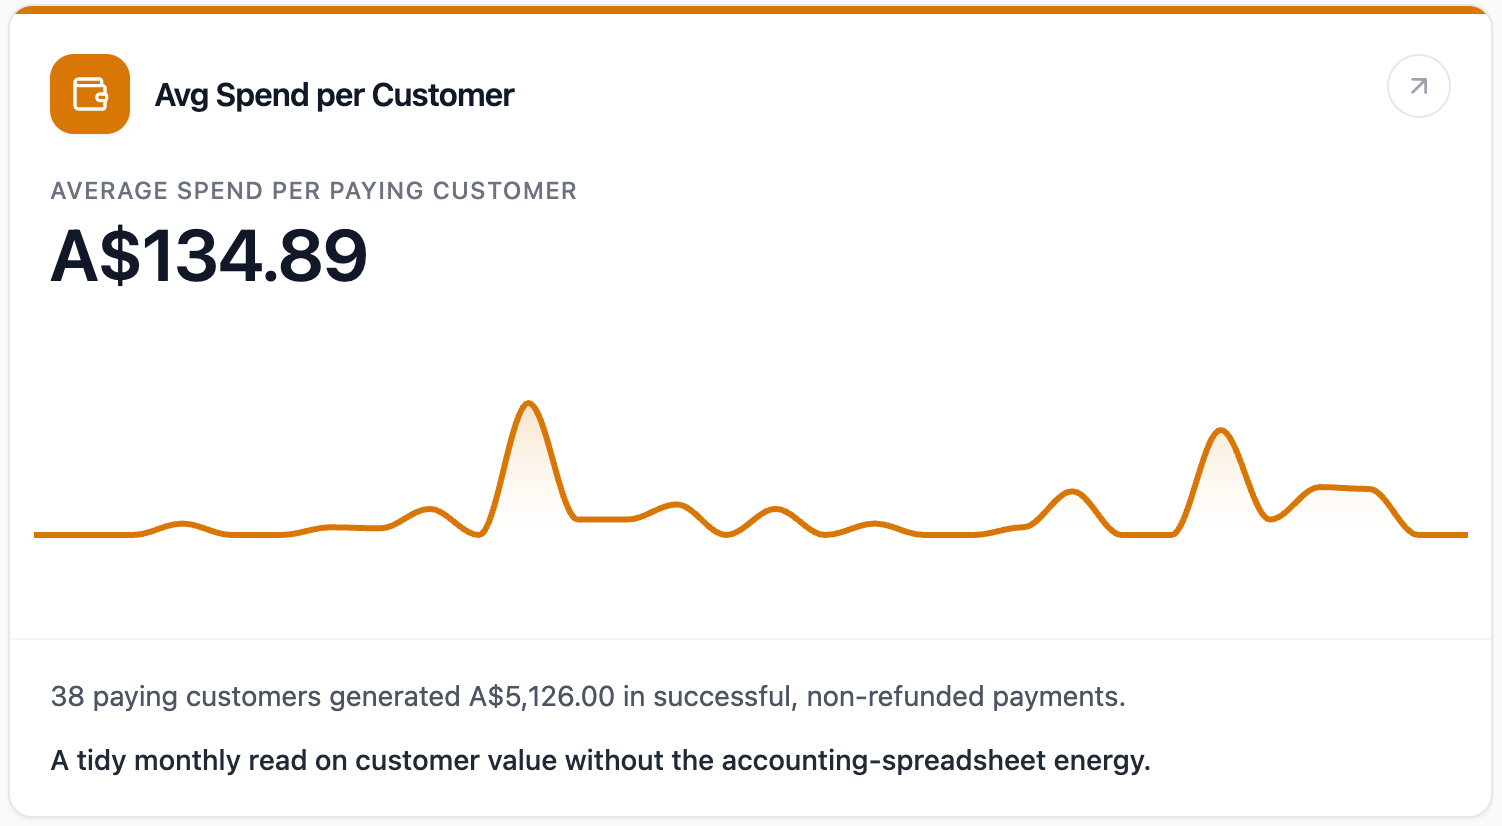
The Avg Spend per Customer report shows how much each paying customer has spent on average during the past 30 days.
Where To Find It
Open Reporting, then select Avg Spend per Customer.
Why This Report Matters
This report gives you a monthly view of customer value. It helps you understand whether revenue is being driven by more paying customers, larger purchases, or both.
Use it when you are reviewing pricing, promotions, membership uptake, or the impact of a new product or offer.
How To Read It
- Average spend per paying customer is the headline number.
- Paying customers shows how many unique customers made successful payments in the window.
- Successful payments shows the number of successful payment records counted.
- Total captured revenue shows the revenue included in the average.
- Average transaction helps show whether the month is being lifted by transaction size or customer count.
- Busiest revenue day highlights the strongest payment day in the window.
What The Number Means
A higher average can mean customers are buying higher-value products, purchasing more often, or renewing larger memberships. A lower average can happen when more new customers are buying lower-cost intro products, or when total revenue has softened.
Read this report beside New Customer Acquisition and Customer Lifetime Value. Acquisition tells you whether new customers are arriving, while lifetime value shows how customer value is building over the whole relationship.
How Clovo Calculates It
Clovo totals successful, paid, non-refunded customer payments created during the past 30 days, then divides that total by the number of unique paying customers.
The report compares the current 30-day average with the previous 30-day average. Deleted, purged, and non-customer accounts are excluded.
Related articles
Find where booked places are being lost with the Cancellations & No-Shows report
Read the Cancellations & No-Shows report: what its 30-day window really covers, why the 24-hour late-cancel split is not your penalty policy, and what the Leakiest classes list leaves out.
Spot members leaving before it shows in your revenue with the Churn Rate report
The Churn Rate report measures the recurring memberships cancelled in the past 30 days against the member base you started that window with, counted from the day each member asked to leave.
Answer questions about your studio with Clovo reports
Reports help you understand what is happening across your studio without needing to build your own spreadsheets. Each report is designed to answer one clear business question, then show the numbers that explain the answer.
Check whether clients are building a habit with the Visits per Customer report
The Avg Visits per Customer report shows how often active customers are booking and attending classes across the past 30 days.