
Answer questions about your studio with Clovo reports

Tobias Gundry
Updated
Reports help you understand what is happening across your studio without needing to build your own spreadsheets. Each report is designed to answer one clear business question, then show the numbers that explain the answer.
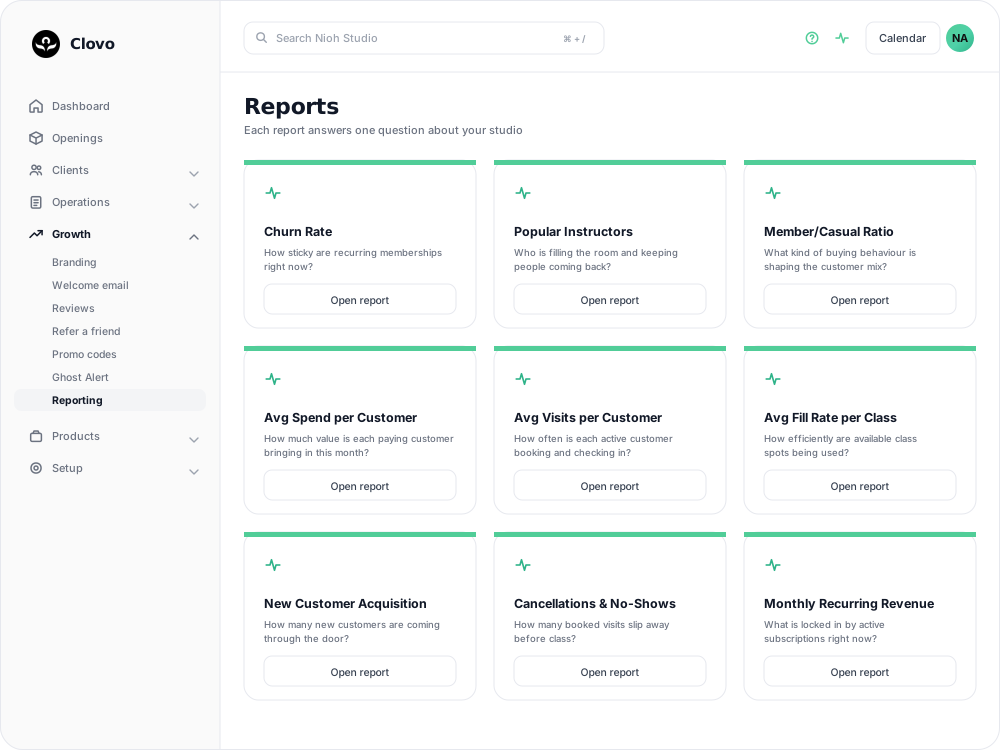
To view reports in Clovo, open Reporting from the dashboard navigation, then select the report you want to read. Most reports focus on the past 30 days and compare that period with the previous 30 days. Where a report uses a different comparison, the article explains it.
Available Reports
- Churn Rate
- Popular Instructors
- Member/Casual Ratio
- Avg Spend per Customer
- Avg Visits per Customer
- Avg Fill Rate per Class
- New Customer Acquisition
- Cancellations & No-Shows
- Monthly Recurring Revenue
- Customer Lifetime Value
- Cohort Retention
How To Read Report Trends
The main number gives you the current signal. The comparison chip shows whether that signal has moved up, down, or stayed steady against the comparison period. A movement is not automatically good or bad on its own. For example, higher new customer acquisition is usually positive, while higher churn usually needs a closer look.
Use reports together when possible. Acquisition shows whether new people are arriving, visits show whether they are building a habit, retention shows whether they stay, and revenue reports show what that activity is worth.
Related articles
Find where booked places are being lost with the Cancellations & No-Shows report
Read the Cancellations & No-Shows report: what its 30-day window really covers, why the 24-hour late-cancel split is not your penalty policy, and what the Leakiest classes list leaves out.
Spot members leaving before it shows in your revenue with the Churn Rate report
The Churn Rate report measures the recurring memberships cancelled in the past 30 days against the member base you started that window with, counted from the day each member asked to leave.
Check whether clients are building a habit with the Visits per Customer report
The Avg Visits per Customer report shows how often active customers are booking and attending classes across the past 30 days.
Find out how full your classes actually run with the Fill Rate report
The Avg Fill Rate per Class report shows how efficiently your available class spots are being used.