
See which instructors your clients book with the Popular Instructors report

Tobias Gundry
Updated
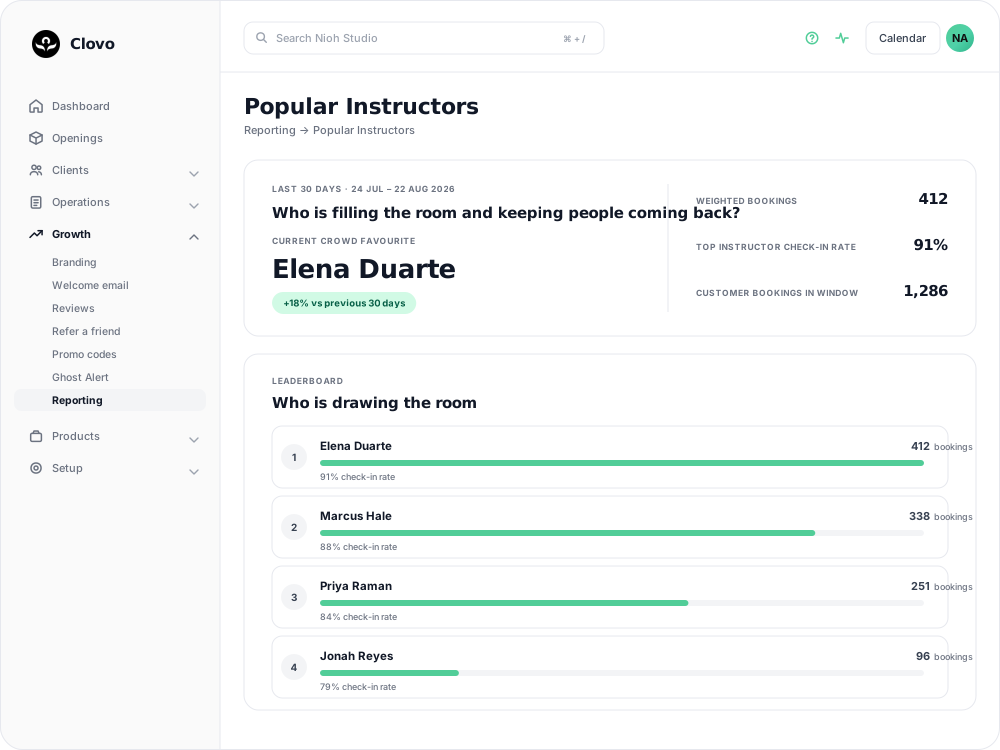
The Popular Instructors report shows which instructors are drawing the strongest booking activity. It helps you understand where demand, class energy, and customer loyalty are showing up in the timetable.
Where To Find It
Open Reporting, then select Popular Instructors.
Why This Report Matters
Popular instructors can influence attendance, waitlist pressure, customer satisfaction, and retention. This report helps you see which instructors are consistently filling rooms and which classes may be worth promoting, repeating, or placing in stronger timetable slots.
It can also help with staffing conversations. A lower number does not automatically mean an instructor is underperforming. It may reflect a newer class, a quieter time slot, a smaller room, or a niche format.
How To Read It
- Current crowd favourite shows the instructor with the most weighted bookings in the past 30 days.
- Weighted bookings show booking volume after co-taught classes are split fairly between instructors.
- Top instructor check-in rate shows how many of the top instructor’s bookings turned into actual arrivals.
- Customer bookings in window shows the total booking activity included in the report.
- Leaderboard ranks the top instructors by weighted bookings.
What The Number Means
High booking volume means customers are actively choosing that instructor’s classes. A strong check-in rate suggests that demand is converting into attendance, not just reservations.
If an instructor has high bookings but a lower check-in rate, the class may still be attractive, but there may be reminder, timing, cancellation, or no-show behaviour to look at.
How Clovo Calculates It
Clovo counts customer bookings from scheduled classes that were not cancelled in the past 30 days. If a class is co-taught, each instructor receives an even share of the booking.
For example, if two instructors teach the same class, each receives 0.5 weighted bookings for each customer booking. The report compares the current leader with the previous 30-day window.
Related articles
Find where booked places are being lost with the Cancellations & No-Shows report
Read the Cancellations & No-Shows report: what its 30-day window really covers, why the 24-hour late-cancel split is not your penalty policy, and what the Leakiest classes list leaves out.
Spot members leaving before it shows in your revenue with the Churn Rate report
The Churn Rate report measures the recurring memberships cancelled in the past 30 days against the member base you started that window with, counted from the day each member asked to leave.
Answer questions about your studio with Clovo reports
Reports help you understand what is happening across your studio without needing to build your own spreadsheets. Each report is designed to answer one clear business question, then show the numbers that explain the answer.
Check whether clients are building a habit with the Visits per Customer report
The Avg Visits per Customer report shows how often active customers are booking and attending classes across the past 30 days.